Wednesday, October 27, 2010

Las Vegas #1 Again! - The Dumbest City in U.S.

If you haven't been hiding under a rock over the last few years, you're probably already aware of some of the various #1 records Las Vegas has attained during this period - records to include:

- The highest unemployment rate in the nation (15% )
- Top city for personal debt (link)
- The highest bankruptcy rate in the nation (link)
- The highest foreclosure rate in the nation (link)
- The most stressful city in the nation (link)
- City where > 80% of homeowners are upside down (link)

Well, as of today - beep, beep, beep... Breaking news!!! Hot off the press - Another #1 label can now be added to the lineup:

Las Vegas is #1 - The Dumbest City

Excerpt:

The site analyzed the nation's 55 metropolitan areas with 1 million or more residents, evaluating those markets based on nonfiction book sales tracked by research firm Nielsen BookScan; the number of libraries per capita; the ratio of colleges and universities; and the percentage of residents older than 25 with bachelor's and master's degrees.

If you tally all of those factors, Las Vegas ranks dead-last among the country's big cities. Of its 1.9 million residents, 14 percent earned bachelor's degrees, and 7 percent hold master's degrees. Las Vegans have bought 1.1 million adult nonfiction books year-to-date, or fewer than one tome per resident. (But hey, we'll go head to head against anybody on adult-video sales!)


Cheers!

Randy

Case-Shiller Housing Chart

S&P Case-Shiller housing data was released Tuesday (report).

Bottom line up front: The report noted a deceleration in home price growth rates in most of the areas surveyed. Take a look at the circled area in the chart below - notice anything? Hmm, could this be the beginning of another leg down for the housing market?


Report Excerpts:

“A disappointing report. Home prices broadly declined in August. Seventeen of the 20 cities and both Composites saw a weakening in year-over-year figures, as compared to July, indicating that the housing market continues to bounce along the recent lows,” says David M. Blitzer, Chairman of the Index Committee at Standard & Poor’s. “Over the last four months both the 10- and 20-City Composites show slowing growth, after sustaining consistent gains since their April 2009 troughs.

“The month-over-month growth rates tell the same story. Fifteen of the 20 MSAs and the two Composites saw a decline in the month of August as compared to July levels. The 10- and 20-City Composites fell 0.1% and 0.2%, respectively. Indeed, the housing market appears to have stabilized at new lows. At this time, it does not seem that any of the markets are hanging on to the temporary momentum caused by the homebuyers’ tax credits.”

Thursday, October 07, 2010

U.S. Deficit $202 Trillion

"Enron Accounting" Has Bankrupted America: U.S. Deficit Really $202 Trillion, Boston University economics professor Laurence Kotlikoff says.

As the deficit grows so does the national debt, which is currently more than $13.3 trillion, according to official figures.

But the situation is actually much, much worse.

“Forget the official debt,” he tells Aaron in this clip. The “real” deficit - including non-budgetary items like unfunded liabilities of Medicare, Medicaid, Social Security and the defense budget - is actually $202 trillion, the professor and author calculates; or 15 times the “official" numbers.

“Congress has engaged in Enron accounting,” says Kotlikoff, who recently penned an op-ed for Bloomberg entitled: The U.S. Is Bankrupt and We Don't Even Know It...


Yahoo link

Wednesday, October 06, 2010

Dollar, Silver and Gold Charts

Before looking at the charts below keep in mind the following: No country in the history of the world has ever been successful in printing their way to prosperity, and the outcome will be no different for the US in this most recent attempt to do so.

Bottom line: Though short term corrections are called for in the charts below, the dollar will most certainly continue to fall while precious metals rise over the mid/long term.


Daily Dollar Chart - oversold (look at the Full STO and MACD) - a short-term bounce is due.


Weekly Dollar Chart - oversold (look at the Full STO and MACD) Again, a short-term technical bounce is overdue, but we're definitely headed lower for the mid to long term.. Note that 75-74 will be key support levels on the downhill slide followed by MASSIVE SUPPORT at 72-71 (If we fall below 71, the USD will be in completely uncharted territory - and at the LOWEST LEVELS EVER - all being relative of course because it's a global race to the bottom now)


Daily Silver Chart - Severely overbought (look at the Full STO and MACD) - a short-term pullback is certainly due. Note that historically when silver pulls back, it usually does so all the way back to its 50 or 200 Day Moving Average (DMA) - will we see the same upon the next pullback (~ $19 an oz)?


Weekly Silver Chart - Further confirmation of an overbought condition (look at the Full STO and MACD) - correction is due. Note silver's recent parabolic rise above it's 50 week Moving Average; also note that historical pullbacks show silver usually falls back to its 50 week MA (~$19 oz) - will this time be any different?


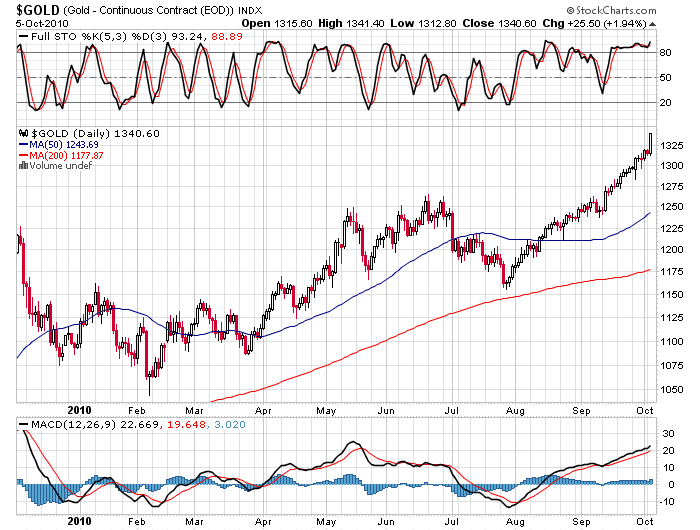
Daily Gold Chart - overbought (look at the Full STO and MACD)- a short-term correction is due. The nearly parabolic rise above the 50DMA is unsustainable, baring a looming currency collapse - but I don't think we're there yet


Weekly Gold Chart - further confirmation of an overbought condition(look at the Full STO and MACD)- a short-term pullback is due.


Closing:

The currency and PM markets are leaning forward quickly - trying to factor in Helicopter Ben's looming QE2 monetary carpet bombing campaign - but they can't continue on like this in perpetuity and they will eventually undergo a short term reversal (always do).

Question of the day:

Should you enter here with a PM purchase?

Personally, I wouldn't, I'd wait for a nice pullback to the 50DMA, but that may take some time and patience, because as John Maynard Keynes stated: "the market can stay irrational longer than you and I can stay solvent" (Not saying I'm a proponent of his economic philosophy - merely that it's a wise comment)

Cheers!

Randy

Tuesday, October 05, 2010

Las Vegas Housing Charts

I've been writing about the Las Vegas housing market for years and have even stated for the record (on several occasions) that this market will eventually fall to a level where the median home price is ~ $60SF.

Note: some of my older posts can be found here:

Charts Feb 2010

Charts April 2009

$60SF Prediction - 2008

Las Vegas Economic Downturn Archives (thru 2008)

Las Vegas: A House of Cards - March 2006

Well, rather than trying convince you with additional verbiage that we've yet to hit bottom, I'll let the charts below do the talking - as each chart is worth a thousand words.

A few key points to keep in the back of your head while reviewing the charts however:

- Las Vegas has the highest unemployment rate in the nation
- Las Vegas has the highest bankruptsy rate in the nation
- Las Vegas has the highest foreclosure rate in the nation
- > 80% of Las Vegas homeowners are upside down
- The Homebuyer tax credit has expired
- Banks are holding back tens of thousands of homes
- The Las Vegas economy is completely dependent on a DEAD BUSINESS MODEL - consumer discretionary spending - something that is no longer available to the masses who are desperately trying to keep a job, a roof over their head and food on the table


Bottom line:

The bottom IS NOT IN for Las Vegas and home prices will likely continue to fall for several more years... Though considered a long-shot losing bet at the time, when we take into consideration all the gloomy (current and future) aspects of this city's economy, even my $60SF median price forecast now seems optimistic.

Sunday, October 03, 2010

Gold price @ $1500 by end of year 2010

Bloomberg Interview w/Jeffrey Nichols (Sr. Economic Advisor to Rosland Capital). Jeffrey: "Great chance of $1500 by EOY"; the gold market is very small market compared to world equity, currency and bond markets and just a small shift in portfolio preference (into gold) will significantly impact this market. Additionally, Asian hunger for the yellow metal is a big plus... Other issues discussed - Weaker dollar, Central Bank purchases, Stagflation, etc